Rent versus buy is the personal finance question most likely to be answered by whoever you asked rather than by any arithmetic. Ask a homeowner and renting is throwing money away. Ask a renter and buying is a liquidity trap with a lawn. Both camps have a calculator that agrees with them, and the calculators disagree because they make different silent assumptions — not because the maths is hard.
The comparison itself is tractable. What matters is knowing which assumptions are doing the work, because in this particular question two of them do almost all of it.
Buying costs more per month and less per decade
Take $2,400 a month in rent against a $475,000 house with 20% down at 6.66% — the 30-year average from the Federal Reserve’s FRED series at the time of writing.
The mortgage alone is $2,442 a month, which looks like a wash. It is not, because a house also charges you property tax, insurance and maintenance, and the all-in monthly cost of owning is $3,511. Owning is over $1,100 a month more expensive than renting from the day you move in.
And yet, over time, buying wins — because most of that money is not spent. Principal payments convert cash into equity, and the house is assumed to appreciate. Net the equity and the appreciation back out at the point of sale, subtract 6% for selling costs, and the true cost of those years of ownership is far lower than the sum of the payments.
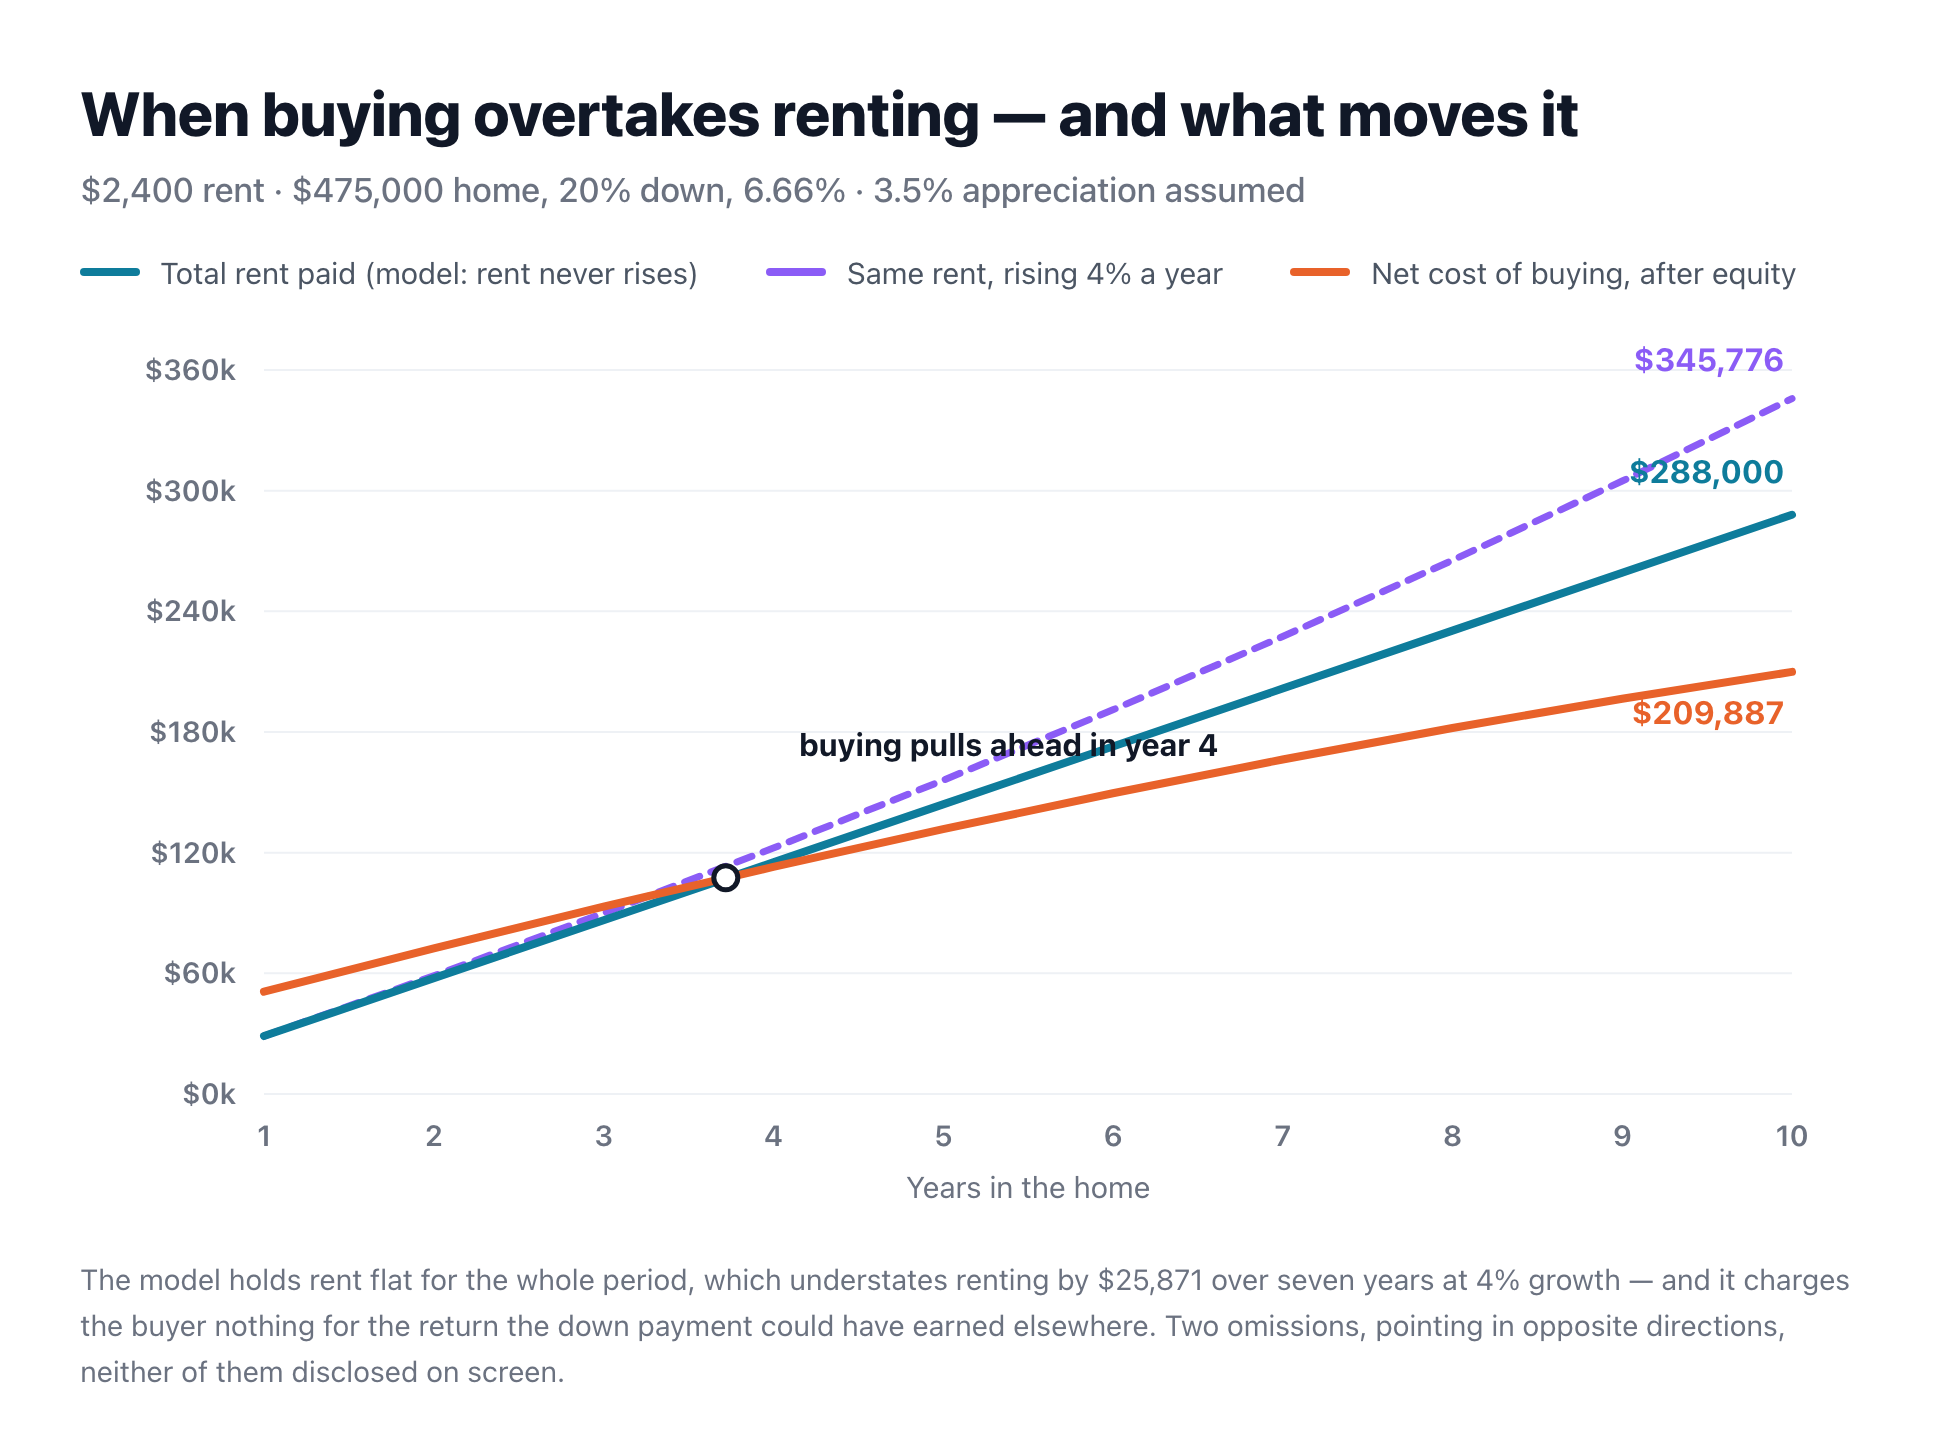
On these numbers the lines cross in year four. Leave after three years and renting was cheaper by about $6,700; stay seven and buying is ahead by $35,282; stay ten and it is ahead by $78,113. This is the real content of the old advice about not buying if you might move in three years — the transaction costs need time to amortise, and before they have, they dominate.
The two assumptions that decide it
Here is the part worth knowing before you trust any rent-versus-buy answer, this one included.
The first is appreciation. The comparison above assumes the house gains 3.5% a year, and that single input more or less determines the verdict. Hold everything else constant over seven years and vary only that:
- At 0% appreciation, buying costs $287,891 against $201,600 of rent — renting wins by $86,291.
- At 2%, renting still wins, by $19,903.
- At 3.5%, buying wins by $35,282.
- At 5%, buying wins by $95,479.
That is a $181,770 swing across a plausible range of a number nobody knows, and the answer flips somewhere between 2% and 3.5%. Any calculator that hands you a confident verdict is really handing you its appreciation assumption with a house drawn around it.
The second is that rent never rises. The model holds your rent flat for the entire period, which is not how renting works. At 4% annual increases the same tenancy costs $227,471 over seven years rather than $201,600 — the comparison is understating the renting side by $25,871, and by nearly $58,000 over ten years. Correct for that alone and the crossover moves earlier.
Two errors, pointing in opposite directions, partly cancelling — which is the most dangerous kind, because the total looks reasonable while both halves are wrong.
There is a third, and it is the mirror image of the second: the model charges the buyer’s down payment as a cost but never credits the renter with what that $95,000 could have earned invested instead. Flat rent flatters renting; ignoring the opportunity cost of the down payment flatters buying. They are not the same size, they do not cancel cleanly, and neither is disclosed on screen.
Three more things it can’t see
- Insurance and maintenance are estimated, not entered. They are modelled at 0.5% and 1% of home value a year, and HOA fees are not modelled at all. Property tax you set yourself — either as your county’s effective rate or as the actual annual bill — and it matters more than it sounds: on this house, moving from a 1.2% rate to 2.4% adds $475 a month and flips the seven-year answer from buying to renting.
- No mortgage interest deduction. The comparison is pre-tax on both sides. For households that itemise, this understates the case for buying.
- Flexibility has a price and it is not in dollars. The genuine argument for renting when you might move is not that it is cheaper — over ten years it usually is not — but that it does not require you to sell a house on someone else’s timetable.
Or let it run itself
Teamint’s Buy vs Rent analysis runs the full comparison — mortgage, tax, insurance, maintenance, amortised equity, appreciation and selling costs — over whatever horizon you specify, and reports the total both ways rather than just a winner. The mortgage rate comes from the current FRED 30-year average; your income and available cash come from what your household has recorded.
The most useful way to use it is not to run it once. Run it at 0%, 2% and 4% appreciation and see whether your answer survives all three. If it does, you have a decision. If it flips, what you have is a forecast, and you should treat it accordingly.
It’s one of the ten Decision Lab analyses on the free Starter plan, so it costs nothing to run, and there’s no bank connection to set up. If you have not settled on a price yet, how much house can we afford is the question that comes first.
Run it on your rent and your market
Free for households of up to two people. No credit card, no bank login.
Mortgage rate reference: Federal Reserve Economic Data (FRED) series MORTGAGE30US, 30-year fixed rate average. Property tax, insurance and maintenance are modelled at fixed percentages of home value and are not tailored to any jurisdiction. Appreciation and rent-growth figures are assumptions, not forecasts. The comparison is before tax and excludes the mortgage interest deduction and the opportunity cost of the down payment. Teamint runs calculations on figures you supply; it does not provide financial, tax, mortgage or legal advice. See our Disclaimer.