Ask a lender how much house you can afford and you will get a confident number back, usually within a day. It is a real number, carefully calculated, and it answers a question you did not ask. The lender is working out the largest loan it can responsibly extend to you. You are trying to work out the largest payment you can live behind for thirty years. Those are not the same question, and the gap between the two answers is where most of the regret in home buying lives.
The good news is that the arithmetic behind the lender’s number is completely open. It is two ratios and a payment formula, and you can reconstruct all of it by hand. Once you can, you can also see exactly where it is optimistic — because it is, in one specific and fairly large way.
Two ratios, and the one that binds
Almost every affordability calculation in American mortgage lending starts from the same pair of limits, usually written as 28/36.
- The front-end ratio, 28%. Your housing payment should not exceed 28% of gross monthly income.
- The back-end ratio, 36%. Your housing payment plus every other monthly debt — car, student loan, card minimums — should not exceed 36%.
You get whichever limit is lower. On a household income of $150,000 — $12,500 a month — the front-end limit is $3,500 and the back-end limit is $4,500 minus whatever you already owe each month.
Which one binds turns out to be more interesting than it looks, and it produces a threshold worth knowing about. Your existing debts do nothing at all to your housing budget until they cross the gap between the two ratios — 36% minus 28%, or 8% of gross income. Below that line, paying off the car changes your maximum by exactly zero. Above it, every additional dollar of monthly debt comes off your housing budget dollar for dollar.
- At $100,000 a year, the line sits at $667 a month of other debt.
- At $150,000, it sits at $1,000.
- At $200,000, it sits at $1,333.
So on $150,000 with $1,000 a month of car and student loan payments, the answer is $3,500 a month and the debts are irrelevant. Add $200 more of debt and the answer drops to $3,300 — and the maximum price falls from $604,639 to $573,517. A $200 monthly obligation moved the number by $31,122. That is a genuinely useful thing to know before you take out a car loan six months ahead of a mortgage application.
What the 28% rule quietly leaves out
Here is the part worth slowing down for, because nearly every calculator on the internet gets it wrong in the same direction.
The 28% front-end ratio is conventionally a limit on PITI — principal, interest, taxes and insurance, the whole housing payment. But the step that converts a monthly payment into a purchase price is a mortgage formula, and a mortgage formula only knows about principal and interest. If you run the 28% figure straight through it, you have quietly handed your entire property tax and insurance bill to the bank as extra borrowing capacity.
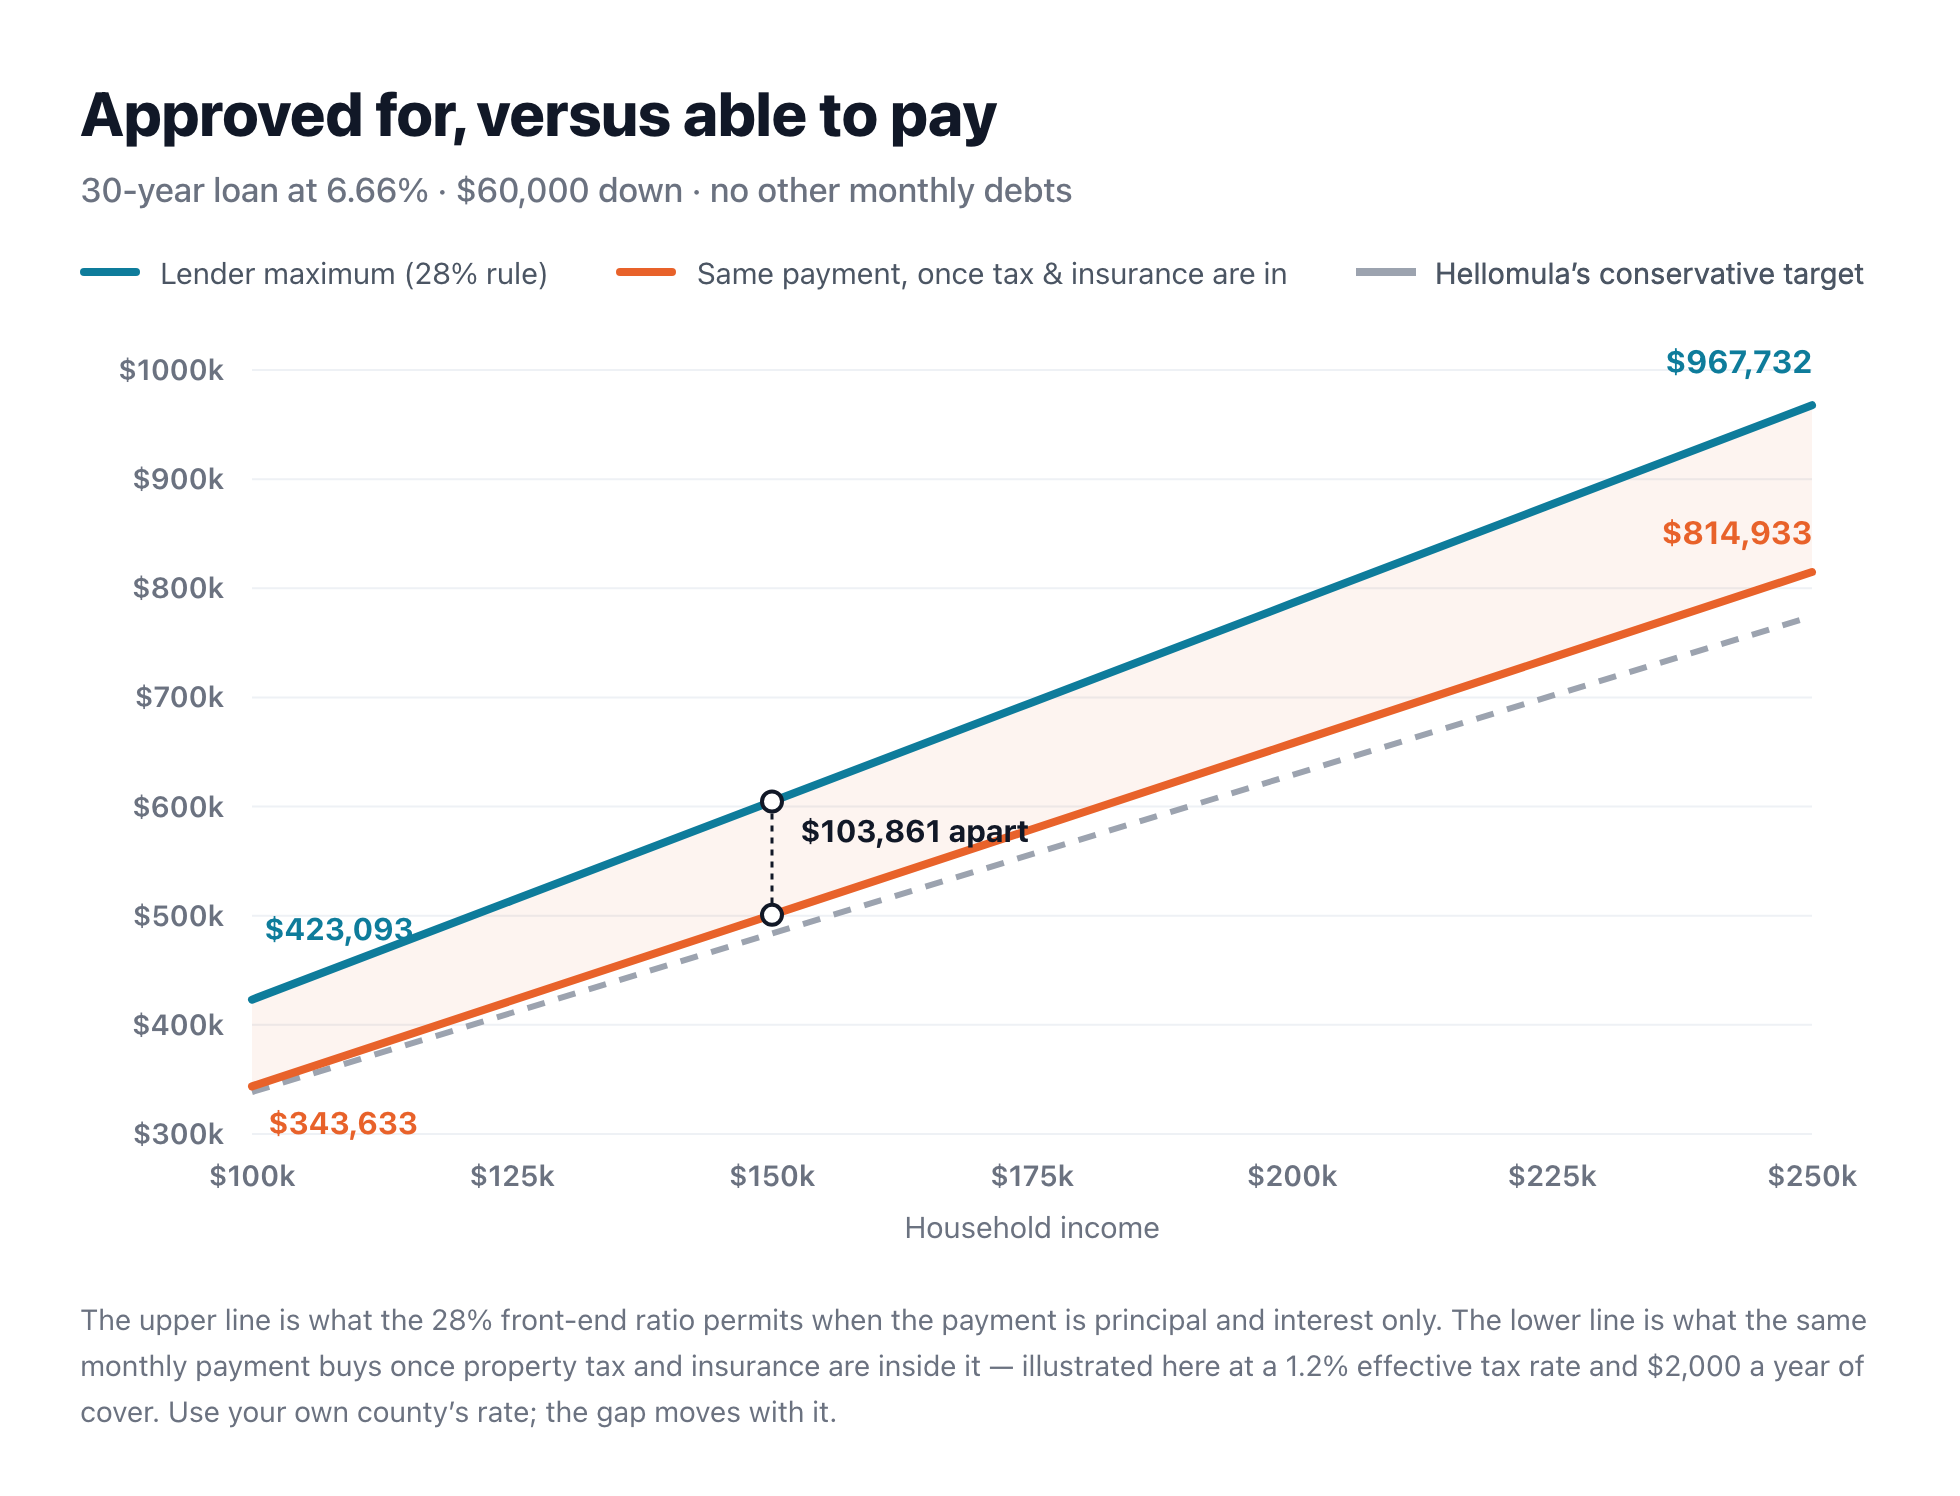
On $150,000 of income the 28% limit is $3,500 a month, which converts to a maximum price of $604,639. Put a 1.2% property tax rate and $2,000 a year of insurance inside that same $3,500 and the price it supports falls to about $500,778. The two answers are $103,861 apart, and neither of them is wrong — they are answers to different questions. The higher one is what a lender will underwrite. The lower one is what $3,500 a month actually buys.
The gap widens as income rises, because it scales with the price of the house: about $79,000 at a $100,000 income, and about $153,000 at $250,000. And it moves with your county. At a 2% effective tax rate it is substantially worse; in a low-tax state, better. This is the single biggest reason two families with identical incomes can afford very different houses.
A lender is answering “what is the most we can lend you?” Only you can answer “what is the most I want to owe?” The first number is a ceiling, not a target.
Running it on your own numbers
Five steps, and every one of them is checkable on paper.
- Take gross monthly income — everyone in the household who will be on the loan, before tax. Lenders work in gross, so this is one place where using your take-home will simply give you the wrong answer rather than a conservative one.
- Compute both ceilings. 28% of that figure, and 36% of it minus your current monthly debt payments. Take the lower.
- Subtract the parts that are not principal and interest — your county’s effective property tax rate applied monthly, plus insurance, plus HOA if there is one, plus PMI if you are putting down less than 20%. What is left is your true P&I budget.
- Convert that to a loan. The standard annuity formula: loan = payment × (1 − (1 + r)−n) ÷ r, where r is the monthly rate and n is the number of months. At 6.66% over 30 years, r is 0.00555 and n is 360.
- Add your down payment. That is your price.
Step 3 is the one every quick calculator skips, and it is the difference between the two lines on the chart.
Four things this arithmetic can’t see
- Maintenance. A house consumes money on a schedule nobody sends you in advance. Roofs, water heaters, trees. None of it appears in a ratio.
- What the ratio displaces. 28% of gross is a rule about the lender’s risk, not about your life. It has no opinion on childcare, on how much you are putting into retirement, or on whether you were planning to drop to one income.
- Income that isn’t a salary. Variable, self-employed and commission income is treated far more conservatively in real underwriting than a flat annual figure suggests.
- The rate on the day. Every figure here uses 6.66%, the 30-year average from the Federal Reserve’s FRED series at the time of writing. A point of rate movement is worth roughly 9–10% of your maximum price — on the $604,639 above, about $52,000 lost if rates rise a point, about $61,000 gained if they fall one.
Or let it run itself
Teamint’s How Much House Can I Afford? analysis runs exactly this arithmetic, and it starts from figures already in your household rather than from an empty form. Income comes from what you have recorded, existing monthly debts from your recurring payments and card balances, the down payment from your actual cash on hand, and the mortgage rate from the current FRED 30-year average rather than a number somebody hardcoded in 2019. In household mode it uses both incomes, which is the version of the question most couples are actually asking.
It reports the lender ceiling, the monthly payment behind it, which of the two ratios is binding on you, and a conservative target set 20% below the maximum. That last number is deliberately blunt, and it lands close to where a full tax-and-insurance correction would put you — a little below it, in fact, which is the right direction for a rule of thumb to be wrong in. Treat the ceiling as information about the lender and the conservative figure as the more honest starting point for a conversation.
It’s one of the ten Decision Lab analyses on the free Starter plan, so it costs nothing to run, and there’s no bank connection to set up — you enter your own numbers.
Run it on your household
Free for households of up to two people. No credit card, no bank login.
Mortgage rate reference: Federal Reserve Economic Data (FRED) series MORTGAGE30US, 30-year fixed rate average. The 28/36 ratios are widely used lender guidelines, not a rule of law — individual lenders and loan programmes apply their own limits, and a pre-approval is the only figure that binds anyone. Property tax and insurance figures in this article are illustrative assumptions, not national averages; use your own county’s rate. Teamint runs calculations on figures you supply; it does not provide financial, tax, mortgage or legal advice. See our Disclaimer.