Every so often a statistic goes around saying the average American saves about 3% of their income, and a great many people read it, glance at their own accounts, and conclude they are doing fine. Some of them are. But the comparison that produced that feeling is not a comparison at all — the national figure and your household figure are measuring different things, on different denominators, at different levels of aggregation.
Knowing your savings rate is genuinely one of the most useful numbers in personal finance. Knowing what it can and cannot be compared against is what makes it useful rather than reassuring.
The number itself is simple
Savings rate is what is left after you have lived and serviced your debts, divided by what came in:
(income − expenses − debt payments) ÷ income
A household bringing in $8,500 a month, spending $6,200 and paying $900 toward debts saves $1,400, which is 16.5%. That is the whole calculation. It takes ten seconds and it is more informative than almost any other single figure you could compute about your finances, because it is the one that determines how fast everything else moves.
At $1,400 a month, compounding at 7%, that household has roughly $232,000 after ten years. Push the rate a single percentage point higher — $85 more a month — and it is about $14,000 more. Savings rate is the lever with the longest handle.
Two yardsticks, and only one of them fits
Once you have the number, you want to know whether it is any good. There are two things people normally hold it up against, and they are not equivalent.
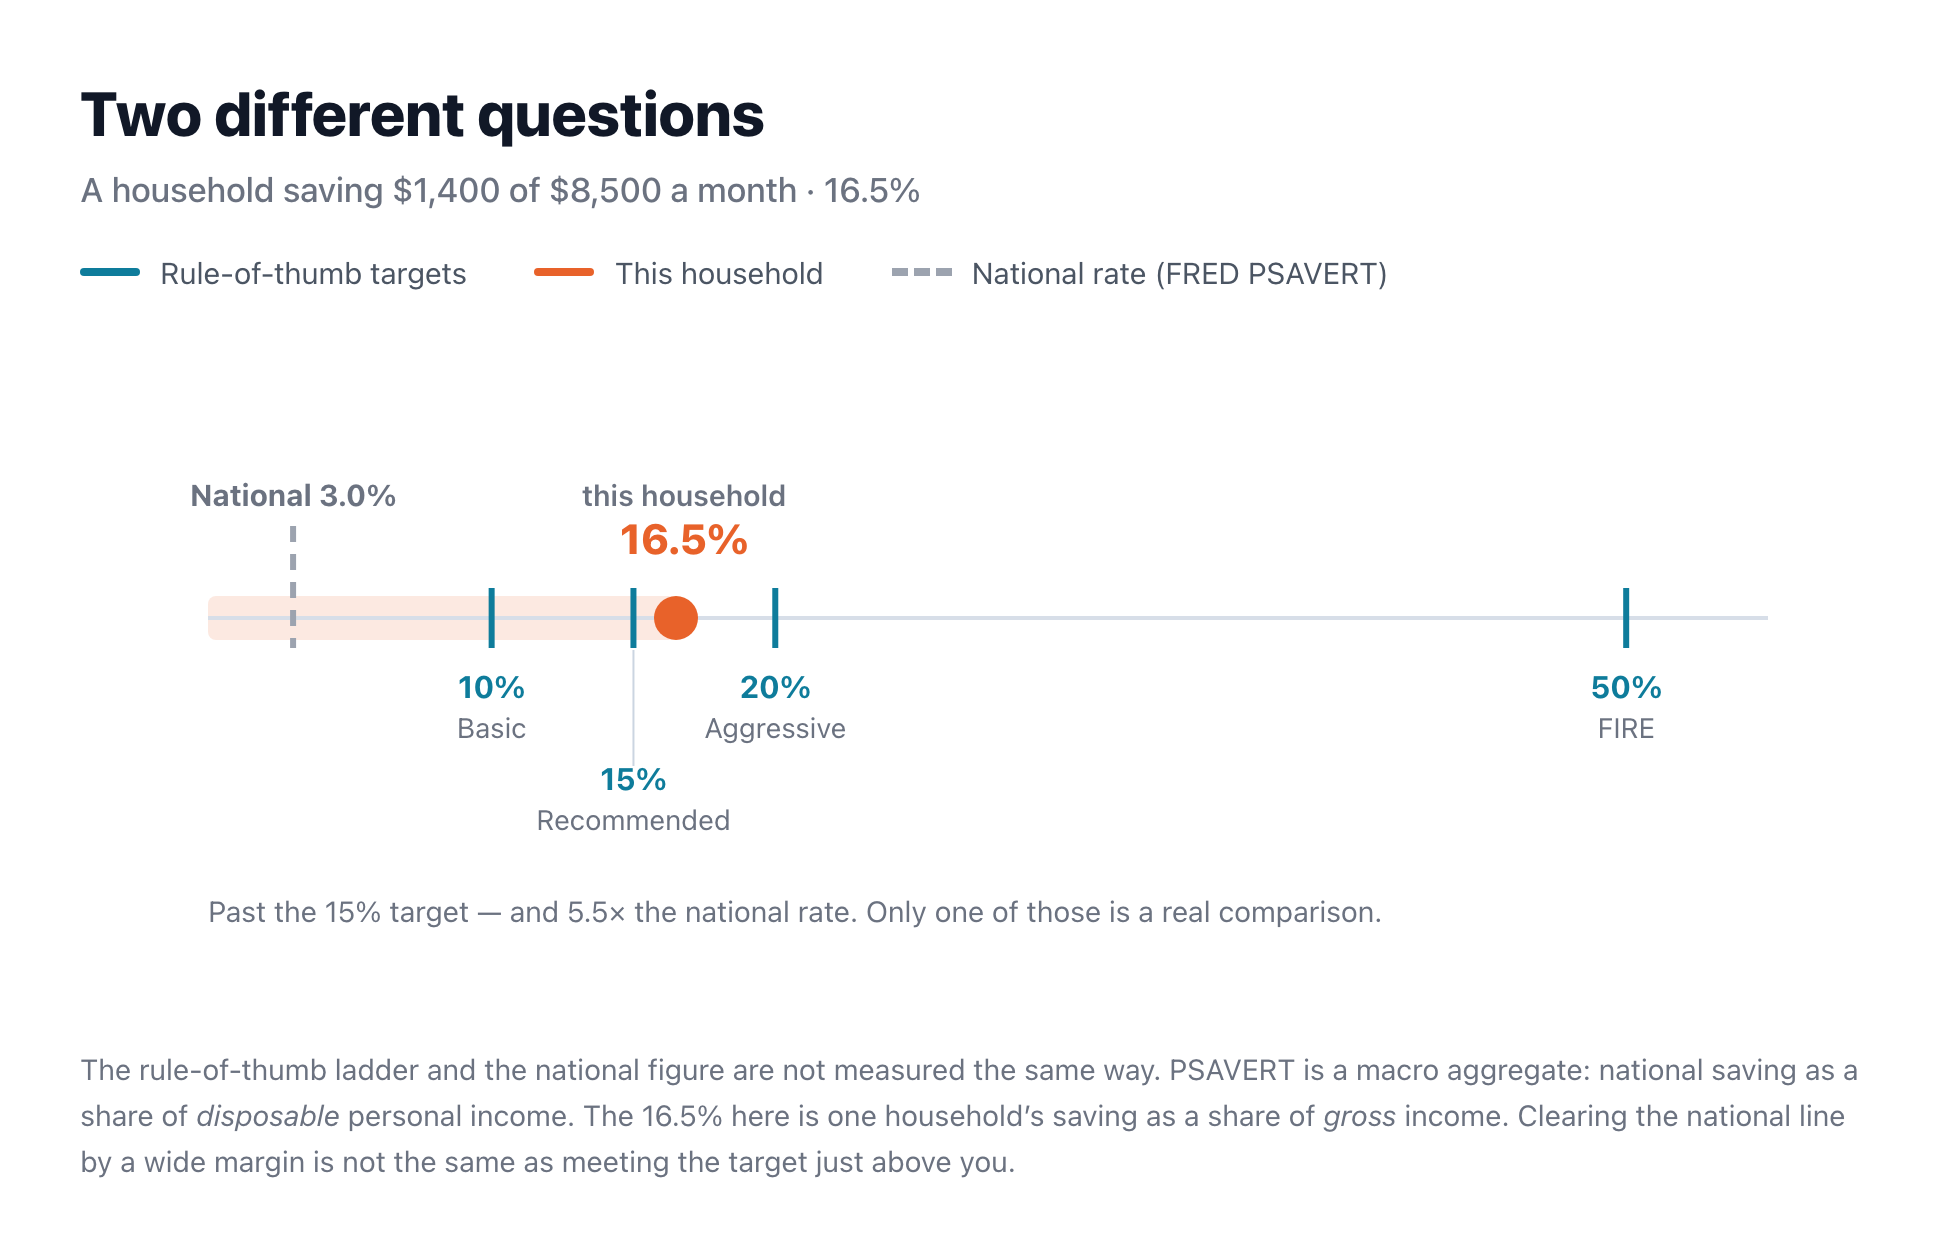
The first is the rule-of-thumb ladder — 10% as a floor, 15% as the common recommendation, 20% as ambitious, 50% and up as the territory of people trying to retire early. These are conventions rather than findings. Nobody derived 15% from data; it became the number because it is memorable and roughly right for a person with forty working years ahead of them. Treat it as a target, which is what it is.
The second is the national personal savings rate, currently around 3%, published by the Federal Reserve as series PSAVERT. This one is a real measurement. It is also not the same measurement as yours, in three specific ways:
- Different denominator. PSAVERT is a share of disposable personal income — after tax. If you compute your own rate on gross income, as most people do and as the arithmetic above does, your figure is mechanically smaller than the same behaviour measured the national way. Comparing them without adjusting quietly flatters the national number and understates you.
- Different unit. It is an aggregate for the entire country, not a median household. A distribution with a long tail at the top does not have a typical member, and the aggregate is not it.
- Different definition of saving. The national accounts count mortgage principal payments and employer retirement contributions in ways a household ledger typically does not. Your 401(k) match is saving in the national statistic; in your own budget it may not even appear.
Beating the national average by five times is not an achievement, because the national average is not a competitor. It is a different measurement of a different thing.
So the household above is genuinely past the 15% target — that comparison holds, because both numbers are its own. It is also 5.5 times the national rate, and that comparison is close to meaningless. The useful sentence is the first one.
Where the number can mislead you
- A good rate on a thin month is not a good rate. Savings rate computed on a single month tells you about that month. Annual bills, insurance renewals and December all sit outside it. Run it on a twelve-month average or accept that it is a snapshot.
- Debt payments sit on the expense side, and that is a judgement call. Paying down principal builds net worth, so a household aggressively clearing debt looks worse on this measure than one that is not. If that is you, the rate is understating your progress — and the honest fix is to look at both this and the debt trajectory rather than to redefine the ratio until it flatters you.
- It says nothing about where the money went. A 20% rate sitting entirely in a checking account and a 20% rate invested across decades produce very different outcomes, and the ratio cannot tell them apart.
- Rules of thumb assume a full career. The 15% convention quietly assumes you started in your twenties. Beginning at forty-five, the same 15% is a materially different plan, and no benchmark on the ladder knows how old you are.
Or let it run itself
Teamint’s Savings Rate Insights is the least effortful analysis in the product, because there is nothing to type. Income, expenses and debt payments all come from what your household has already recorded, so it computes the rate, places it on the rule-of-thumb ladder, compares it against the current FRED national figure, and projects the ten-year value of what you are putting away — from a standing start.
The national comparison is there because people want it, and it is drawn from the live series rather than a number somebody typed into a template three years ago. Read it as context, not as a scoreboard — for the reasons above, the ladder is the comparison that will actually tell you something.
It’s one of the ten Decision Lab analyses on the free Starter plan, so it costs nothing to run, and there’s no bank connection to set up — you enter your own numbers.
Find your rate
Free for households of up to two people. No credit card, no bank login.
National savings rate: Federal Reserve Economic Data (FRED) series PSAVERT, personal saving as a percentage of disposable personal income. The 10/15/20/50% figures are widely used conventions, not findings, and no single rate is appropriate for every household. Projection figures assume a 7% nominal annual return, are not adjusted for tax or inflation, and are illustrations rather than forecasts. Teamint runs calculations on figures you supply; it does not provide financial or investment advice. See our Disclaimer.