It is the most common money question with no universal answer, and the reason it has no universal answer is that it depends on two numbers: the rate on your loan, and a return nobody can promise you. Most calculators handle the first badly and the second dishonestly.
The comparison, in one line
Paying extra principal earns you a certain return equal to your mortgage rate. Every dollar of balance you retire is a dollar that stops accruing interest at exactly that rate, guaranteed, for as long as the loan would have run.
Investing the same money earns you an uncertain return. If that return is higher than your mortgage rate, investing puts you ahead. If it is lower, prepaying does. That single comparison — assumed return against your actual rate — is the spine of the whole decision, and everything else is a refinement on top of it.
So the useful version of the question is not “should I pay off my mortgage?” It is: at my rate, what return would investing have to beat — and how confident am I of beating it?
What it looks like on a real loan
Take a balance of $350,000 at 6.66% — the 30-year average from the Federal Reserve’s FRED series at the time of writing — on a $2,249 monthly payment, with $400 a month extra.
- Prepaying clears the loan in 239 months instead of 361 — ten years and two months sooner — and avoids $177,207 of interest.
- Investing that same $400 a month for those 239 months reaches $300,841 at an assumed 7% return, or $130,594 at 3%.
Plot the invested figure across a range of assumed returns and the shape of the decision becomes obvious: one line is fixed by your contract, the other is a guess that swings by $170,000 depending on how optimistic you are.
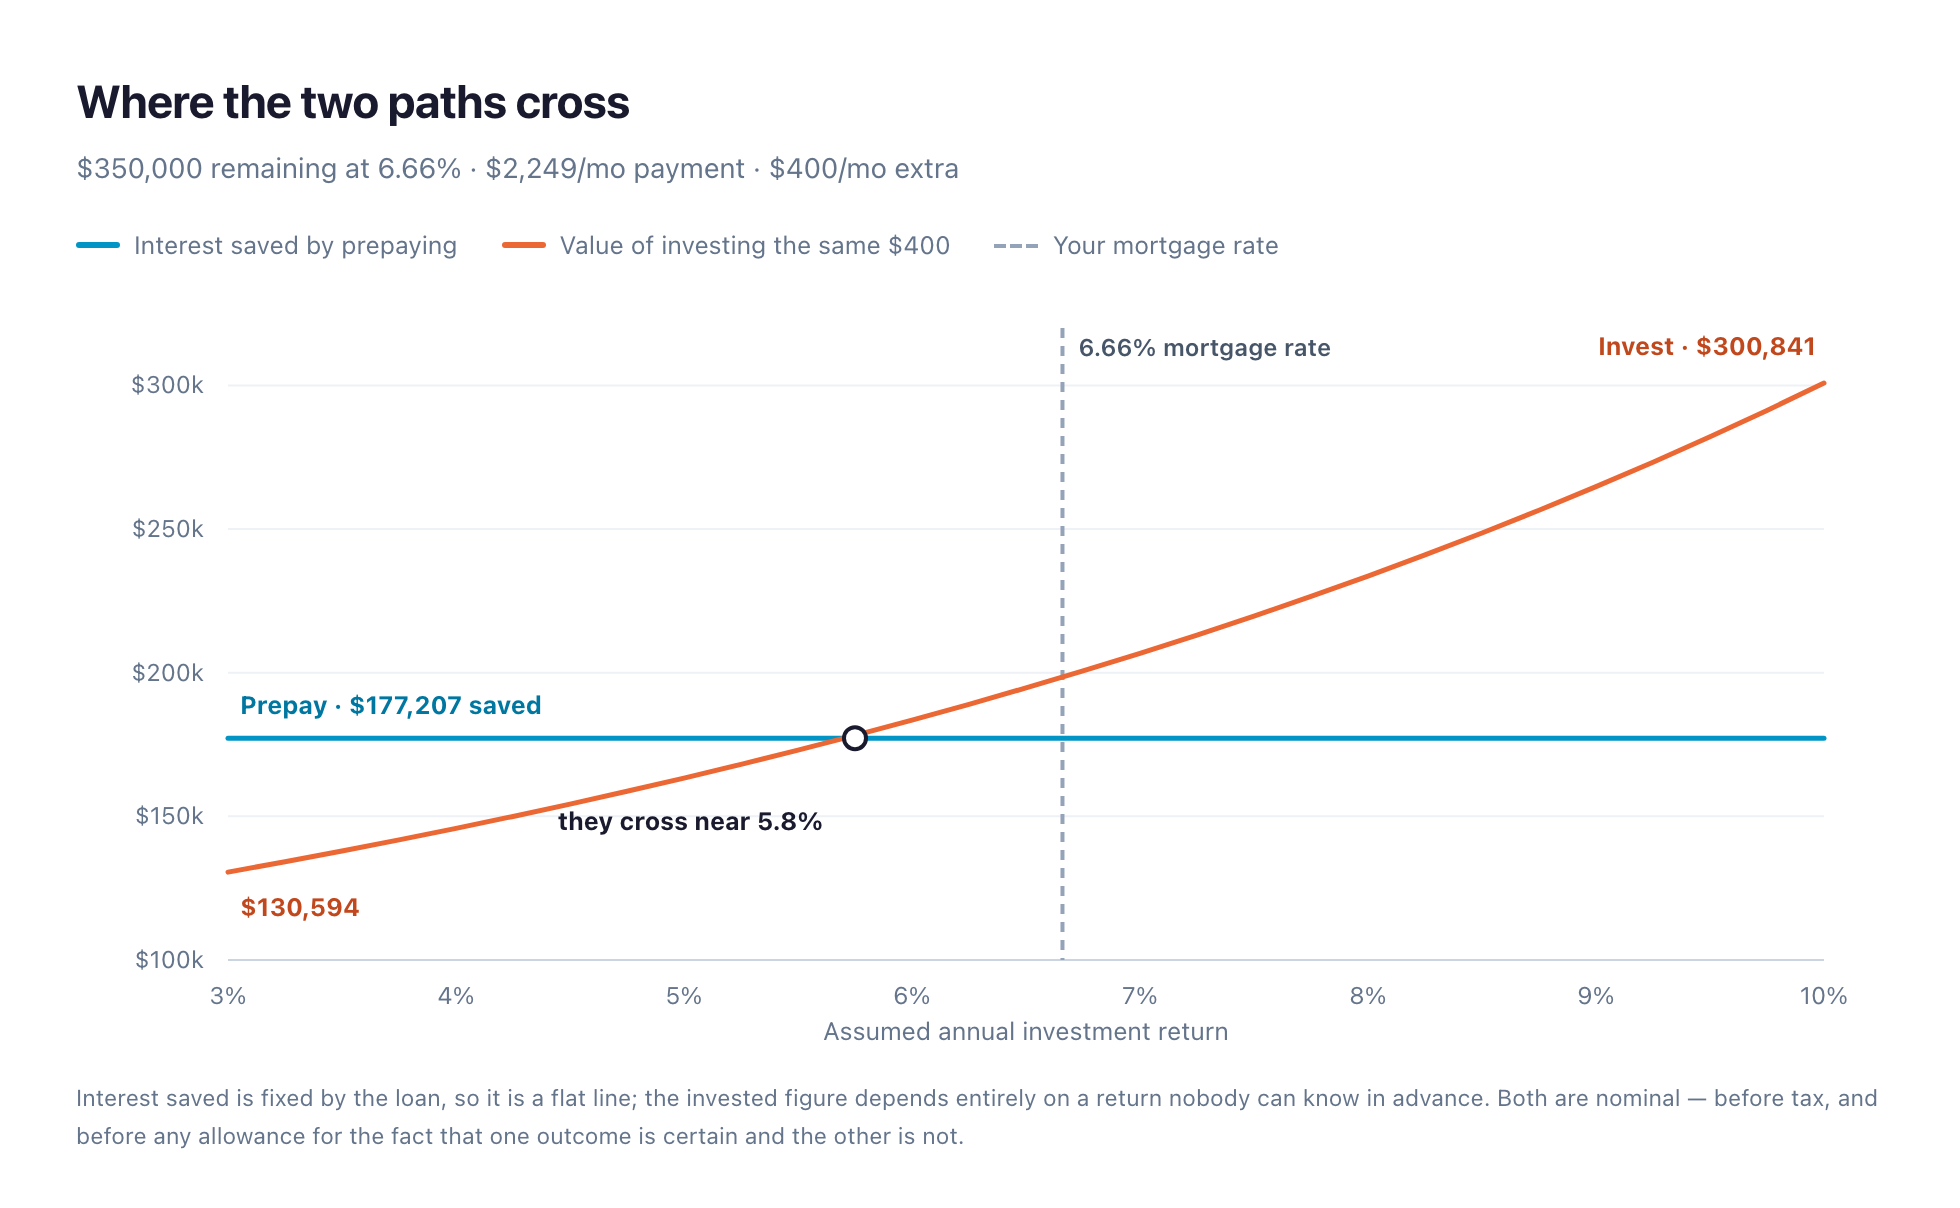
Notice that the two dollar figures cross a little below 6%, while the mortgage rate sits at 6.66%. That gap is not a rounding error — it is a sign that comparing “total interest saved” against “final invested balance” is not quite comparing like with like. The interest saving accrues gradually over 239 months; the invested balance is a single number at the end of them. Rate-against-rate is the cleaner comparison, and it is the one to trust when the two framings disagree.
Five things the simple comparison leaves out
Any calculator that gives you a clean yes or no is hiding at least these five. None of them are edge cases.
- Certainty is worth something, and the comparison prices it at zero. A 6.66% guaranteed return and a 7% expected return are not the same product. The first is a contract; the second is an average across decades that includes years of losing a third of your balance. Comparing the two numbers as if they were equivalent is the single biggest simplification here.
- Tax changes both sides. Investment gains may be taxed on the way out; mortgage interest may be deductible if you itemise, which lowers the effective rate you are comparing against. Which way this cuts depends on your bracket, your account types and whether you itemise at all.
- Where you invest matters more than whether you invest. An employer match is an immediate return no mortgage rate competes with. Money in a 401(k) or IRA compounds under different rules than money in a brokerage account.
- Prepaid principal is not spendable. Money in an index fund can be sold in a bad month. Money in your walls cannot, short of a refinance or a HELOC — both of which need you to qualify at the time you need them, which tends to be exactly when you cannot.
- The freed-up payment. Prepay and the whole $2,249 stops leaving your account ten years early. What you do with it for those ten years is part of the outcome, and the two-line comparison above ignores it entirely.
Two smaller ones worth checking before you send a single extra dollar: whether your loan carries a prepayment penalty, and whether you are still paying PMI — because reaching 20% equity removes a cost that is not in either column above.
Running it on your own loan
Every figure above came from a worked example. The problem with worked examples is that they are somebody else’s loan — a round balance, a tidy rate, an extra payment chosen to make the arithmetic land nicely.
Teamint’s Mortgage Payoff analysis runs the same month-by-month amortisation on your balance, your rate and your payment, prefilled from the mortgage account already in your household. It shows both schedules side by side, the interest avoided, the months saved, and what the same money would have reached invested at whatever return you think is fair.
That last part is the point. The expected return is your assumption, visible and editable — not a number we picked and hid. Change it from 7% to 4% and watch the answer move; if it flips, you have learned that your decision rests on an assumption rather than on arithmetic, which is worth knowing before you commit $400 a month to it. The current 30-year mortgage rate shown for reference comes from the Federal Reserve’s FRED data and refreshes automatically.
What it does not do is tell you what to do. It compares a nominal rate against a nominal rate. The five considerations above are yours to weigh, and if the two paths land close together, that is the honest answer: at your rate the decision is nearly a coin toss, and you should probably choose on how much you value sleeping well over the next ten years.
Run it on your actual mortgage
One of the ten Decision Lab analyses on the free Starter plan. No credit card, no bank login.
Mortgage rate reference: Federal Reserve Economic Data (FRED) series MORTGAGE30US, 30-year fixed rate average. Investment return figures are assumptions, not forecasts, and are not adjusted for tax or for investment risk. Teamint runs calculations on figures you supply; it does not provide financial, tax or investment advice. See our Disclaimer.