Ask what college will cost when your five-year-old turns eighteen and you will get a number. Ask twice, with a slightly different assumption about inflation, and you will get a very different number. That is not a flaw in the arithmetic — it is the honest shape of the answer, and the reason to be suspicious of any college calculator that hands you one figure and a monthly contribution without showing you what it assumed.
Thirteen years of compounding will do that. It is also why the useful output of this exercise is a range and a direction of travel rather than a target you can hit precisely.
Two compounding curves, pointed at each other
The structure of the problem is simple. Two things grow between now and enrolment: the cost of college, and whatever you have saved. Whichever grows faster wins, and your job is to make sure it is the second one.
Take a five-year-old, a college costing $35,000 a year today, $12,000 already saved and $300 a month going in at an assumed 7% return. Thirteen years out:
- Your savings grow to about $101,424. That figure barely moves no matter what you assume about college, because it depends on your return, not on tuition.
- The four-year bill, however, lands anywhere between $141,000 and $337,000 depending entirely on what you assume about cost inflation.
One side of the comparison is fairly stable and the other is wide open. The gap between them — your shortfall — inherits all of that uncertainty.
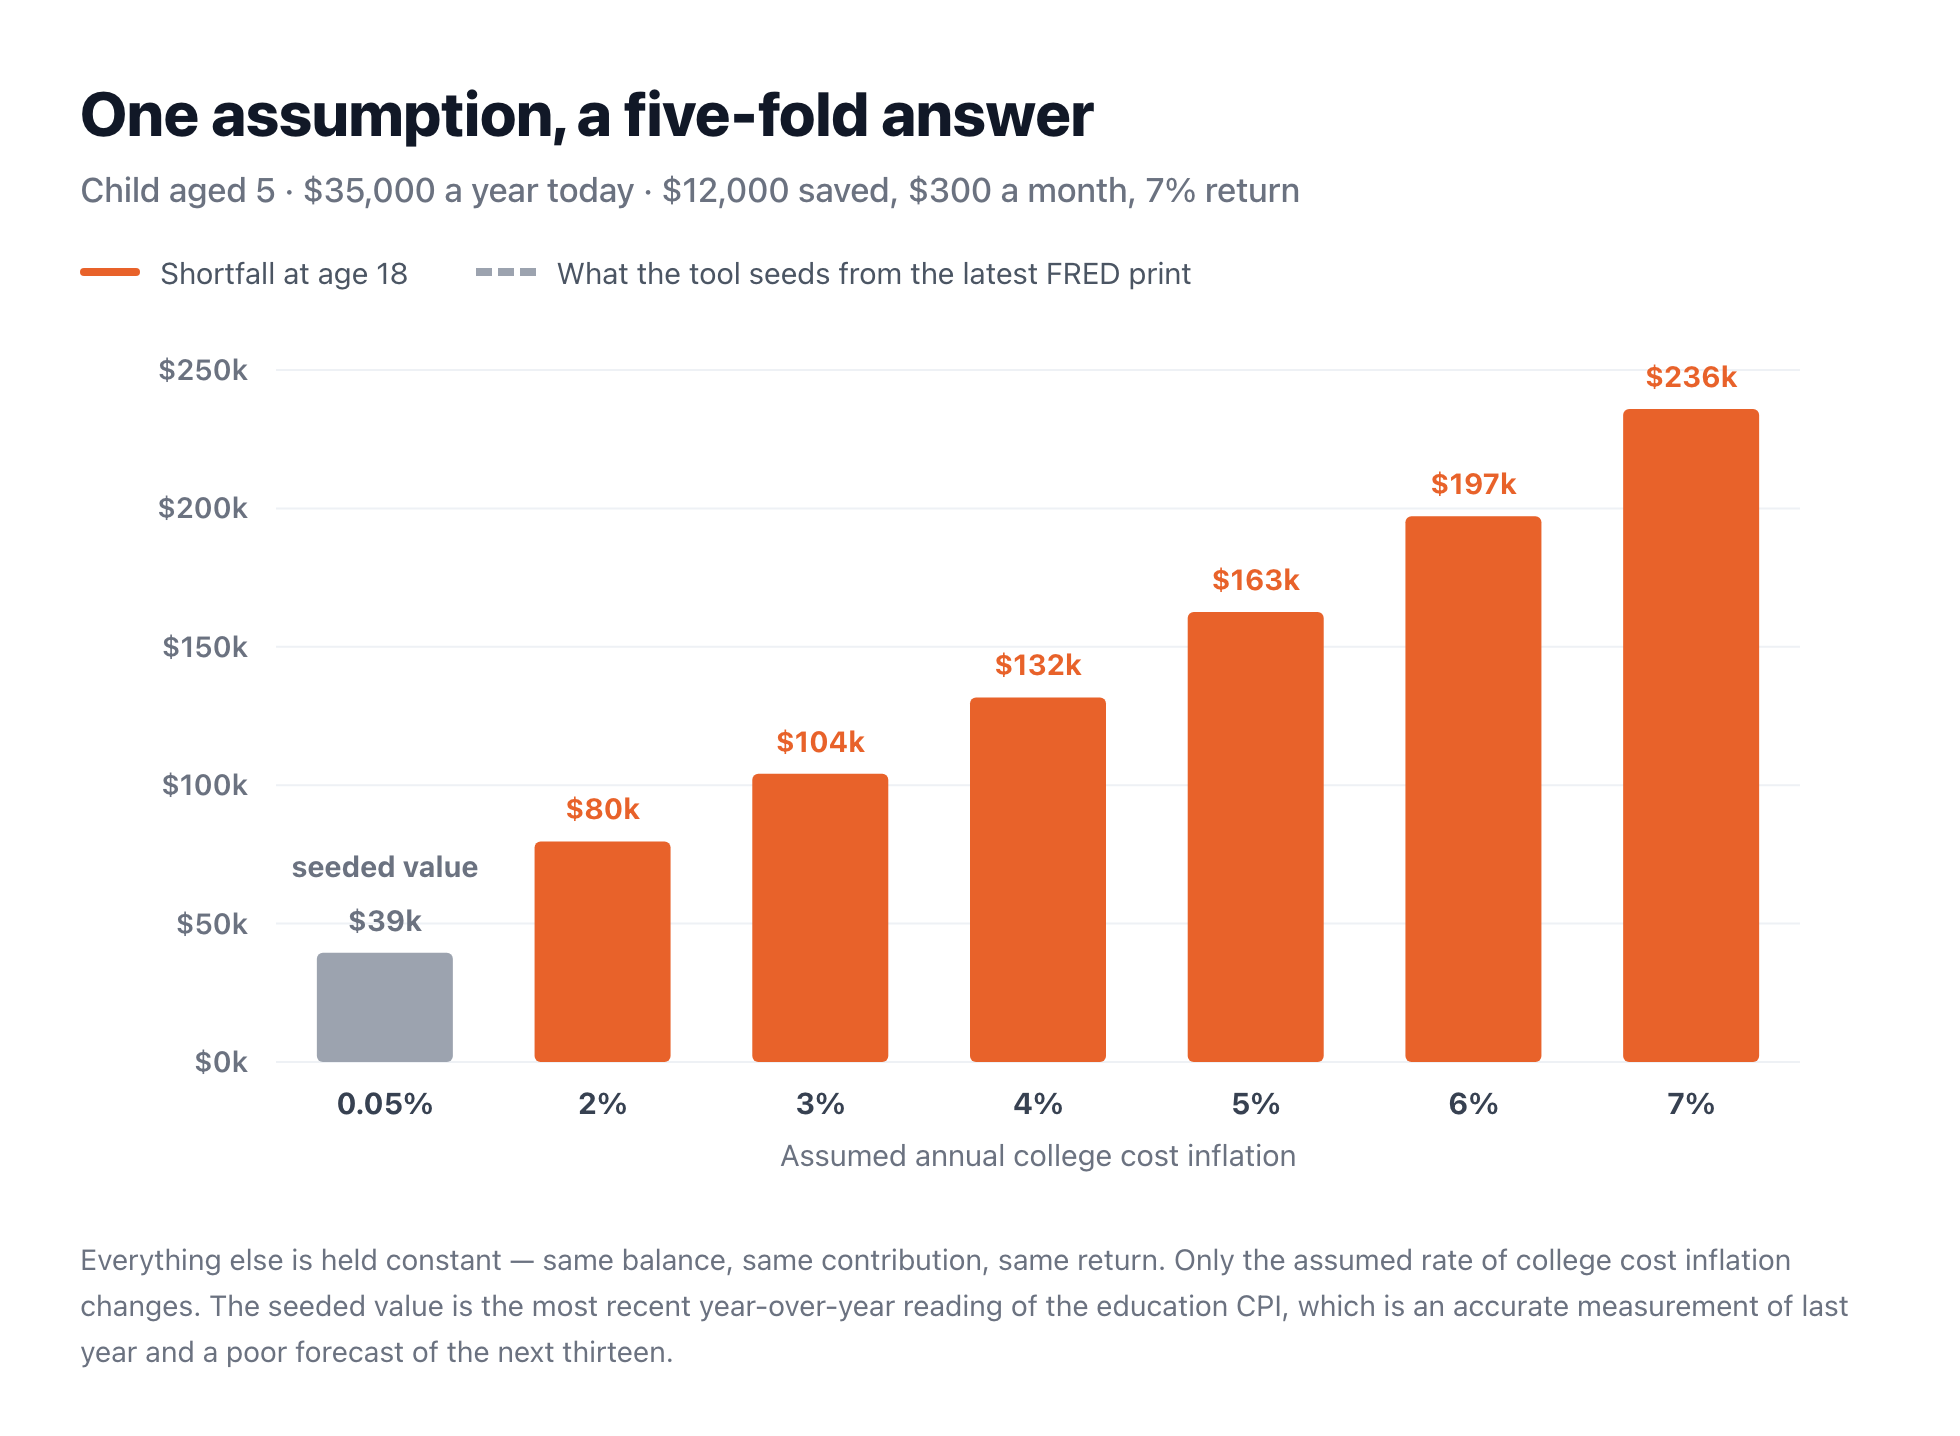
At 3% assumed inflation the shortfall is $104,170. At 6% it is $197,186. The family has not changed anything about its behaviour between those two bars; somebody changed one field.
Where that assumption should come from — and where it shouldn’t
Here is a trap worth naming, because Teamint walks into it and so does most of the category.
The obvious way to pick an inflation assumption is to look it up. The Federal Reserve publishes the education component of the Consumer Price Index, and the tool seeds your projection from the most recent year-over-year reading of it. That reading is currently about 0.05% — education prices were essentially flat over the last measured year — which produces the leftmost bar above and a shortfall of $39,488.
That number is an accurate measurement and a terrible planning assumption. One year’s CPI print describes the year that just ended; it is not a forecast of the next thirteen, and education costs have historically run well ahead of general inflation over long periods rather than flat. Seeding a thirteen-year projection from a single recent observation is how you end up believing you are $39,000 short when the more defensible range starts around $100,000.
A live data feed is not automatically a better assumption than a considered one. Freshness and relevance are different properties, and long-horizon projections need the second.
The practical fix is to overwrite the seeded figure and run the projection at least three times — a low case, a middle case and a pessimistic one — and to plan against the middle while knowing where the pessimistic one sits. Which is exactly what you would do with any thirteen-year forecast if the tool had not offered to fill it in for you.
Four more assumptions inside the number
- It models the sticker price. There is no financial aid, no scholarship, no grant in this projection. Published cost is what a family paying full freight would face, and most families do not. This is the single largest reason a projected shortfall can overstate what you will actually write cheques for — and the single hardest thing to forecast thirteen years out, which is why it is left out rather than guessed at.
- College starts at 18 and lasts exactly four years. No gap year, no fifth year, no graduate school, no starting at a community college and transferring. Each of those moves the answer materially.
- One cost figure covers every kind of institution. In-state public, out-of-state public and private differ by a factor that dwarfs most of what else is being modelled here. $35,000 is a placeholder; substituting a real published cost for the kind of school you actually have in mind is the highest-value edit you can make.
- Contributions never change. $300 a month is assumed to be $300 a month for thirteen years. In practice most families step contributions up as income rises, which the projection cannot see — so a shortfall shown today is a shortfall on the assumption that you never increase anything.
What to do with the answer
The output most people want is a monthly number, and there are two of them. At the seeded rate, fully funding this child needs about $463 a month in total — but $300 of that is already going in, so the family is $163 a month away. At a more defensible 5% inflation assumption the total needed is $973 and the increase is $673.
The gap between “you need $463” and “you need $163 more” is the difference between a plan and a discouragement, which is why the analysis reports both figures rather than the total alone.
And time is doing more work here than the contribution is. The same family starting when the child is two rather than five faces a shortfall of $5,301 instead of $39,488 on identical assumptions — because three extra years of compounding on both the balance and the contributions is worth more than anything else available to them. If the answer looks bad, starting sooner beats saving harder.
Or let it run itself
Teamint’s College Savings Planning (529) analysis handles multiple children at once, each with their own age, balance and contribution, and reports the projected cost at enrolment, the projected balance, the shortfall and the monthly figure that closes it — per child and combined.
Change the inflation assumption from whatever it seeds, and run it more than once. That is not a workaround; it is the correct way to use any projection with a thirteen-year horizon.
It’s one of the ten Decision Lab analyses on the free Starter plan, so it costs nothing to run, and there’s no bank connection to set up — you enter your own numbers.
Run it on your own children
Free for households of up to two people. No credit card, no bank login.
Education cost inflation reference: Federal Reserve Economic Data (FRED) series CPIEDUSL, year-over-year change. A single year-over-year reading is a measurement of the past, not a forecast. All cost, return and inflation figures in this article are assumptions used to illustrate the method; they are not predictions and no projection here accounts for financial aid, scholarships, grants or tax treatment of any particular savings vehicle. 529 plans are state-administered and their rules and tax treatment vary. Teamint runs calculations on figures you supply; it does not provide financial, tax, investment or education-funding advice. See our Disclaimer.