The question usually arrives at a bad moment. A colleague lets a number slip. A recruiter emails a range that starts above what you make. A job posting appears for what looks like your exact role, with a band you’d have to be promoted twice to reach. And then you spend forty minutes typing average salary for [your job] into a search box and come away knowing less than when you started.
That isn’t your fault. The number those searches return is close to useless — not because it’s wrong, but because of the shape of the answer.
An average is the wrong shape of answer
There are two problems with “the average salary for X,” and the second one is much bigger than the first.
The first is that plenty of sources quote a mean when they should quote a median. In pay data those come apart badly, because the top of the range runs a very long way and the bottom cannot go below zero. A handful of very high earners drag a mean upward until it describes almost nobody. The median — the middle person, half above and half below — is the more honest single number.
The second problem is the one that actually matters: any single number collapses a distribution. Job titles are not pay grades. The spread inside one title is enormous.
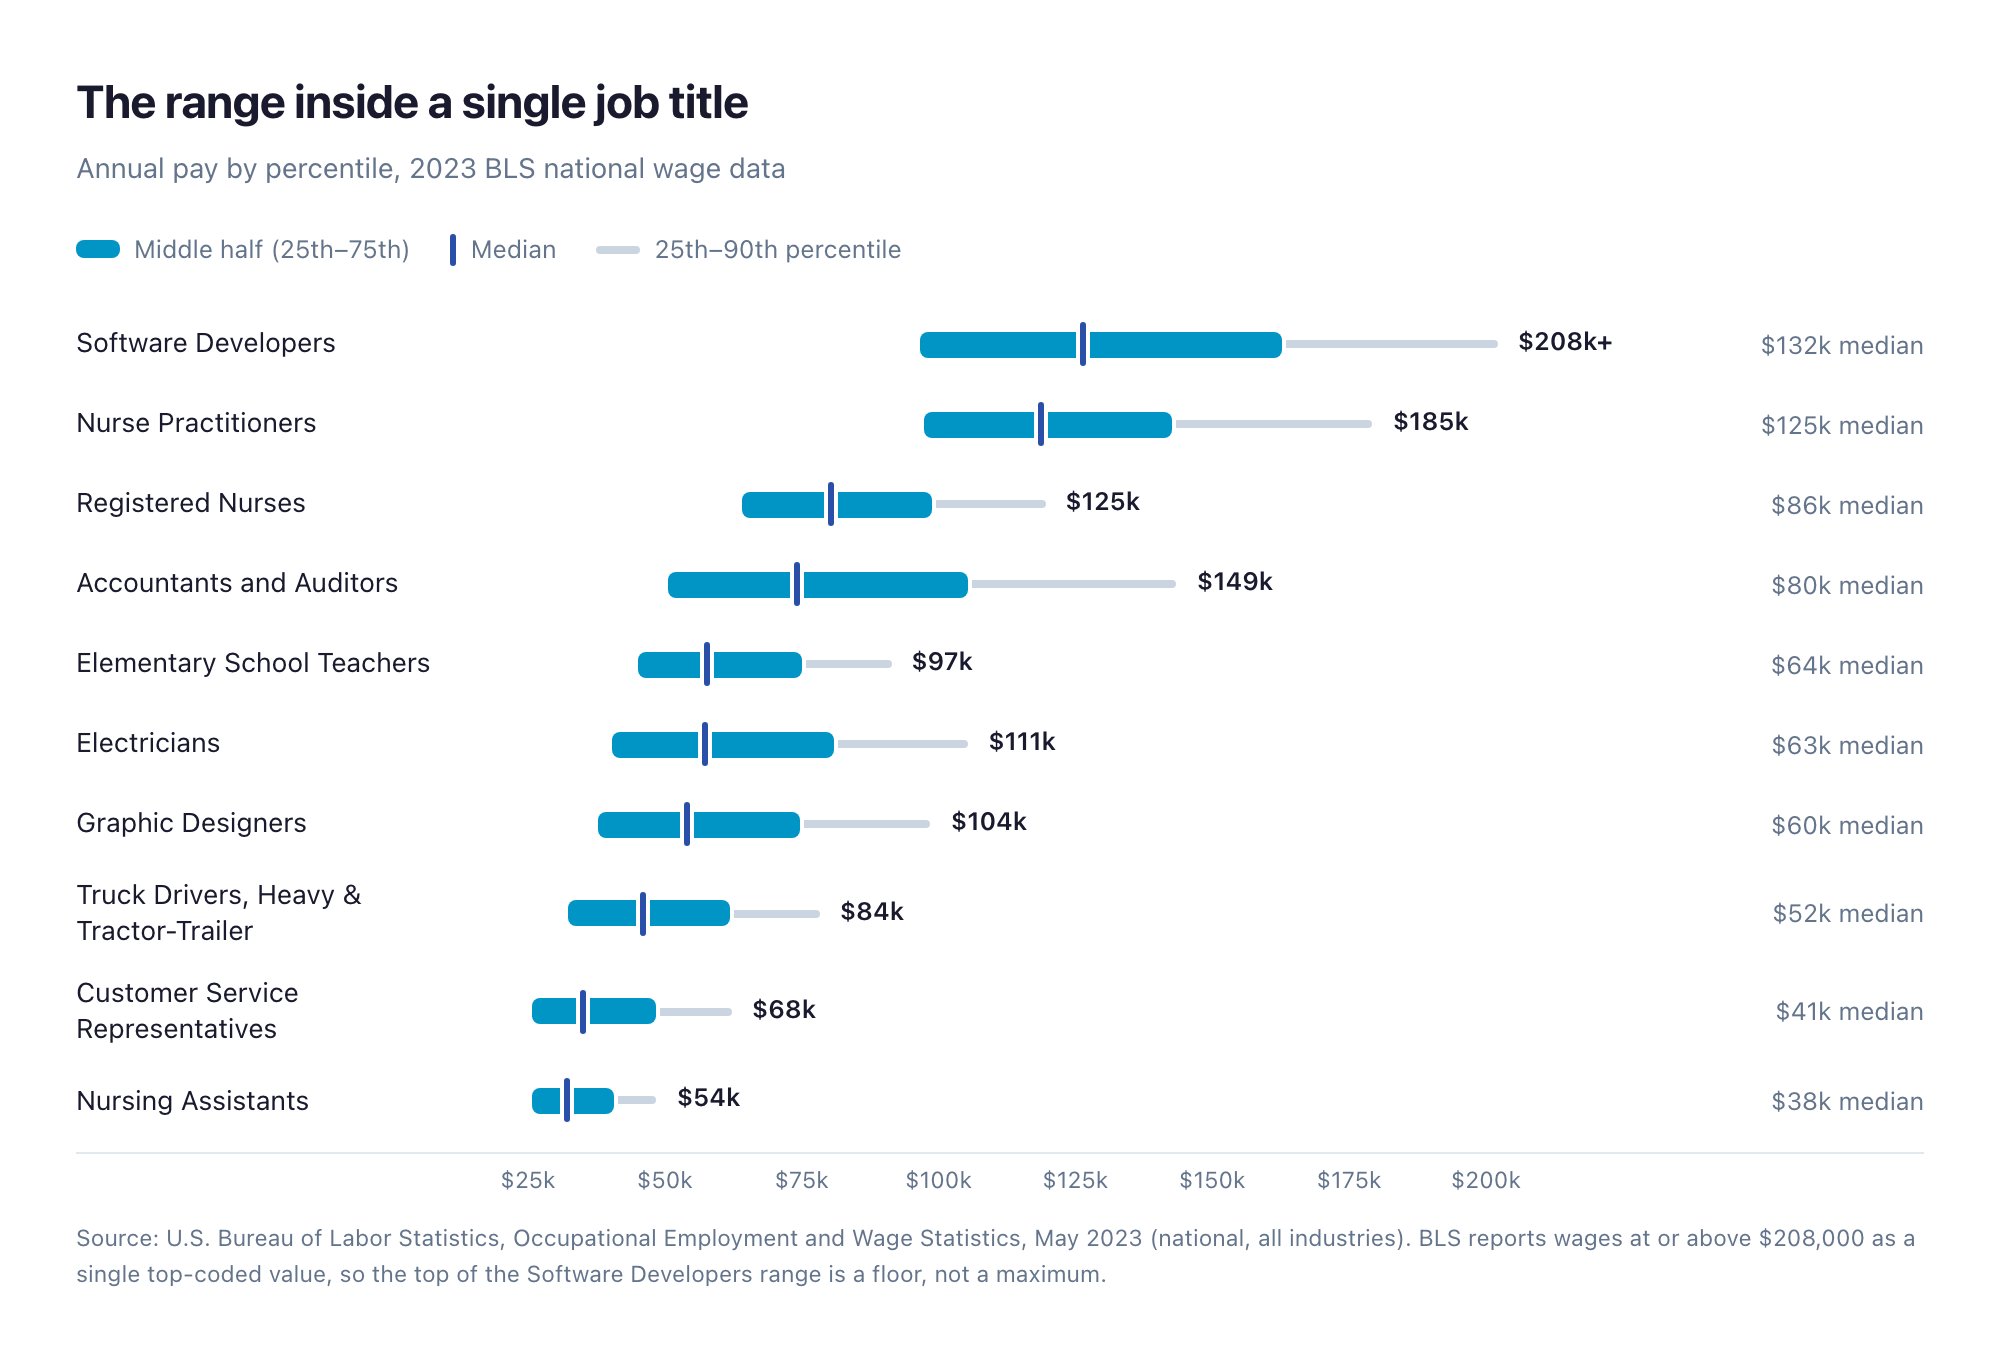
Take accountants and auditors. The median is $79,880 — but the middle half of the profession spans $56,510 to $111,410. That is a $54,900-wide band of people with the same two words on their business card. The 90th percentile, $149,380, earns more than two and a half times the 25th.
Then look across the rows rather than along them, because that is where it gets genuinely strange. The range inside most of these titles is wider than the gap between them. An electrician at the 75th percentile earns $86,580. The median registered nurse earns $86,070. The electrician is ahead.
“What does a nurse make?” and “what does an electrician make?” have overlapping answers. Your title tells you far less than where you sit inside it.
The number you actually want is a percentile
A percentile answers a different question. Not “what does this job pay?” but “out of a hundred people doing my job, how many earn more than I do?” It converts a vague unease into a position you can point at.
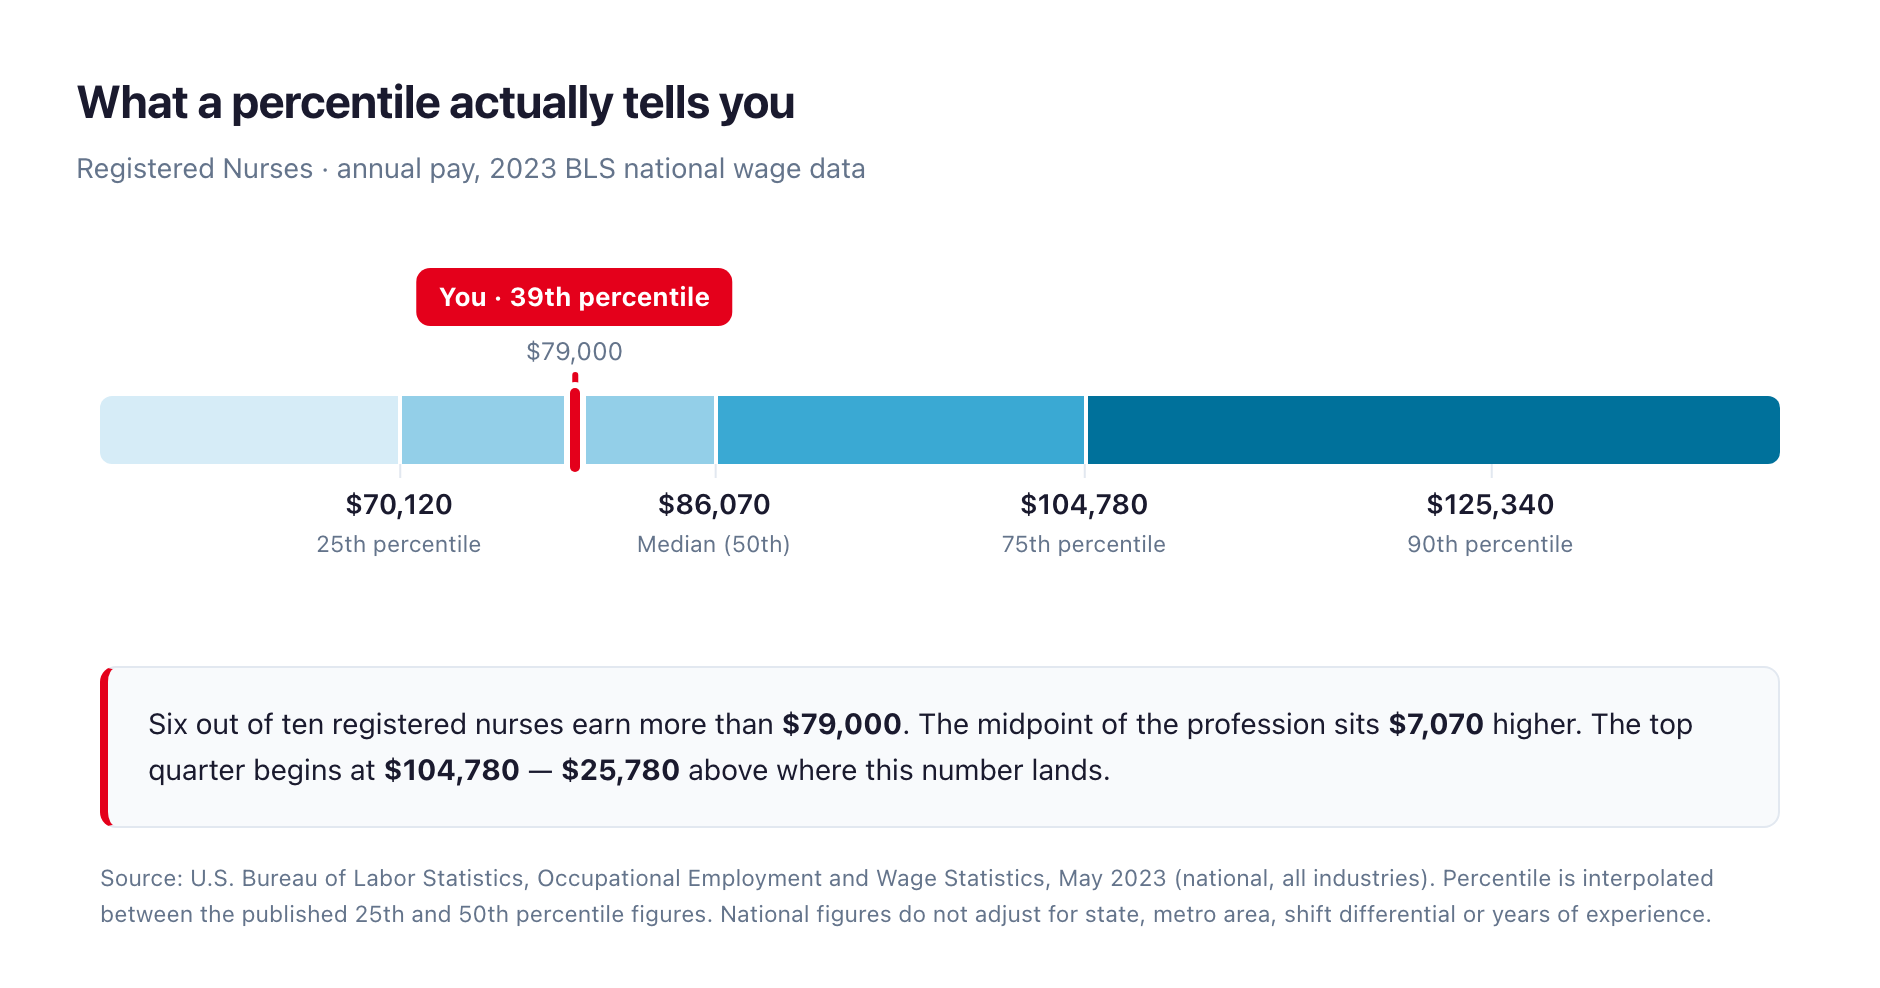
Say you’re a registered nurse earning $79,000. The national median is $86,070, so you already know you’re below it — but “below the median” is a mood, not information. The percentile is 39th. Six nurses in ten earn more than you. The midpoint of the profession sits $7,070 up. The top quarter starts at $104,780.
That is a different kind of sentence, and the difference shows up most in a conversation with your employer. “I think I’m underpaid” is a feeling, and feelings are easy to absorb and move past. “I’m at the 39th percentile nationally for my occupation, and I’d like to talk about what moving toward the median looks like” is a position. It cites a source, it names a target, and it can be checked — which means it has to be answered.
Three things a national number can’t tell you
A percentile is a starting point, not a verdict. Before you take one into a salary conversation, know exactly where it is thin.
- Where you live. National figures average a metro where a two-bedroom costs $4,000 a month with one where it costs $1,100. For most occupations that difference is worth more than the gap between two adjacent percentiles.
- How long you’ve been doing it. A percentile mixes the 24-year-old two years in with the 30-year veteran. Some of the distance between you and the median is experience you haven’t had time to accumulate yet, and that part is not a pay problem.
- What industry you’re in. The same title pays differently in hospital systems, agencies, government and startups — and those differences often come bundled with pension, stability or hours that never appear in the salary figure.
And be clear-eyed about the data itself. Every figure in this post comes from the U.S. Bureau of Labor Statistics May 2023 Occupational Employment and Wage Statistics release. It is the most carefully measured national wage picture available — drawn from employer payroll records rather than self-reporting — but it is a 2023 baseline, not this morning’s market. Two years of raises sit between that survey and your next conversation.
One more quirk worth knowing, because it will confuse you the first time you meet it: BLS reports every wage at or above $208,000 as a single top-coded value. That is why the software developer row above ends in “$208k+” rather than a real number. At the top of the scale the data stops resolving.
Running the number on yourself
You can do this on paper in about five minutes.
- Start with base salary. Not total compensation. The BLS figures are wages, so comparing your salary-plus-bonus-plus-equity against them will flatter you and quietly ruin the comparison.
- Find your occupation’s published percentiles — the 25th, 50th, 75th and 90th. Match the occupation, not the job title on your contract. “Senior Growth Ninja” is a marketing specialist.
- Place yourself between the two nearest figures. Our nurse earns $79,000, between the 25th ($70,120) and the median ($86,070). She is $8,880 into a $15,950-wide gap, so she’s 56% of the way across a band that spans 25 percentile points: 25 + (0.56 × 25) ≈ the 39th percentile.
That is the entire method. It is arithmetic, not analytics, and the fact that you can check it by hand is the point — a number you can reconstruct is a number you can defend.
Or let it run itself
Teamint’s Salary Benchmark does the same arithmetic against the same 2023 BLS figures, using the income already recorded in your household — your percentile, the distance to the median, the 75th and the 90th, and what closing each gap would be worth over a year. It currently covers 40 occupations across engineering, healthcare, education, the trades, legal, sales, management and administration.
It’s one of the ten Decision Lab analyses on the free Starter plan, so it costs nothing to run, and there’s no bank connection to set up — you enter your own numbers. Salary benchmarking is unusual in a personal-finance tool; we built it in because “am I underpaid?” is a money question that household budgeting software normally leaves you to answer alone.
Find your percentile
Free for households of up to two people. No credit card, no bank login.
Wage figures throughout: U.S. Bureau of Labor Statistics, Occupational Employment and Wage Statistics, May 2023, national, all industries. Teamint runs calculations on figures you supply; it does not provide financial, career or legal advice.