Every number in HelloMula is computed, not generated. This page shows the working — every method, every source, and every simplification.
Financial projections are only as good as their assumptions, and most tools hide theirs. We publish ours, including the places where our model is simpler than reality. If you are comparing HelloMula against another product, this page is the honest basis for that comparison.
Three principles govern every calculation:
| Input | Source | Freshness |
|---|---|---|
| 30-year mortgage rate | Federal Reserve Economic Data — MORTGAGE30US | Current |
| Long-run inflation expectation | Federal Reserve Economic Data — T10YIE (10-year breakeven) | Current |
| Medical, education and shelter inflation | Bureau of Labor Statistics CPI series (CPIMEDSL, CPIEDUSL, CPIHOSSL) | Current, with documented historical fallbacks |
| National wage percentiles by occupation | Bureau of Labor Statistics | 2023 data — static, not updated live |
| Tax brackets, standard deduction, FICA thresholds | IRS, stored by tax year and filing status | Maintained per tax year |
| RMD start ages and life-expectancy factors | IRS, SECURE Act 2.0 | Current |
| Expected return, volatility, retirement age, target expenses | You. Defaults are offered; every one is editable | Yours |
Live figures are cached, with a documented fallback chain: the most recent fetched value, then the last known good cached value, then a published historical default. A projection never silently fails to a zero.
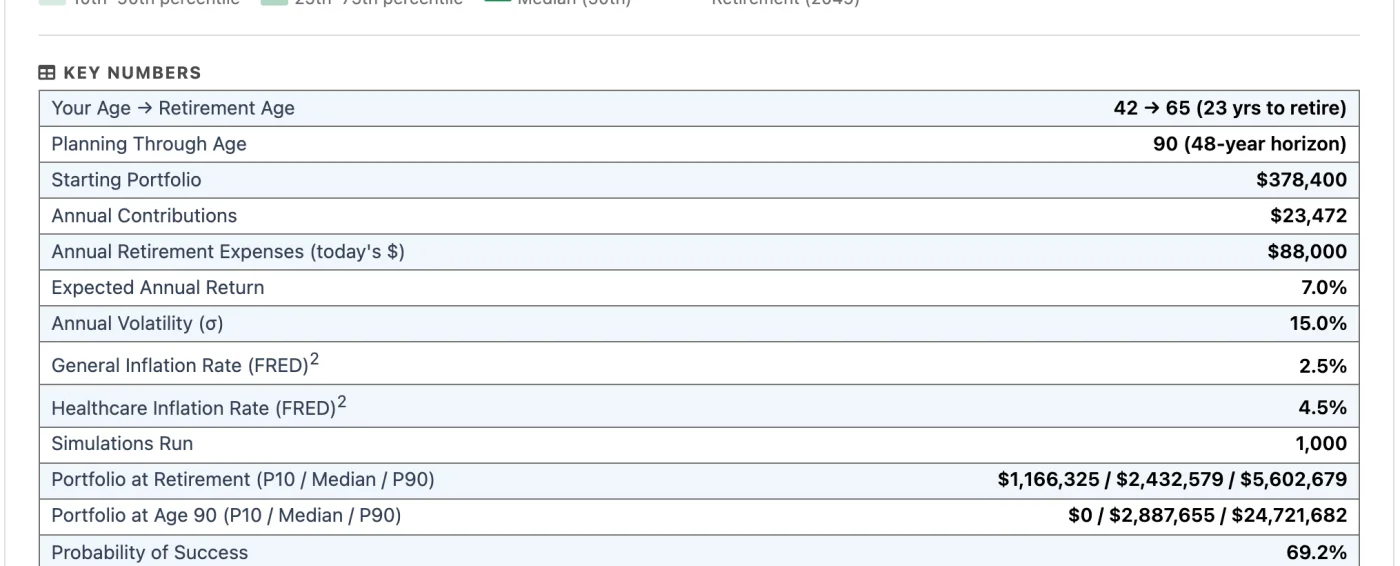
1,000 simulations, drawn from a lognormal return distribution, with federal income tax on every retirement withdrawal solved year by year. Here is exactly how it works; the simplifications it still makes are listed at the end.
HelloMula runs 1,000 independent simulations of your portfolio from today to the end of your planning horizon. Each simulation applies a different randomly drawn sequence of annual returns, which is why the result is a probability rather than a single figure.
Returns are drawn from a lognormal distribution parameterised by the
expected return and volatility you set. Random normal variates are generated
with the Box–Muller transform, and the drift term is adjusted
(μ = ln(1 + r) − ½σ²) so that your stated
expected return is the arithmetic mean of the simulated distribution rather
than drifting high.
Each simulated year runs in two phases:
A retirement plan that debits the portfolio in pre-tax dollars overstates its own odds. Ours does not. If you need $80,000 of spending and the money sits in a traditional 401(k), the withdrawal has to be large enough that what survives the tax bill is $80,000. We solve for that gross figure in every retirement year:
The projection reports the federal tax you are expected to pay across the whole of retirement, and your effective rate on it.
One consequence worth stating plainly: a model that ignores this returns a higher probability of success than ours does. That difference is not accuracy — it is a tax bill that still arrives, quietly left out of the arithmetic. If you have compared HelloMula against a tool that shows you a friendlier number, this is usually why.
Two honest caveats. Current tax law is held constant for the life of the projection, and a future Congress may change it. And the tax-deferred share of your portfolio at retirement is projected once at your expected return rather than separately in each of the 1,000 scenarios — the ratio moves far less across scenarios than the balance does, because both account types earn the same return in any given year.
We report the share of the 1,000 runs in which the portfolio was never exhausted, a percentile fan from the 10th to the 90th, a year-by-year table of the median path, and the average age at depletion across the runs that did fail. Up to five one-time future expenses — a college year, a roof, a wedding — can be placed in specific years.
A real bracket-by-bracket walk using IRS brackets for the selected tax year and filing status, plus FICA including the additional Medicare surtax, and the greater of the standard deduction or your itemised total. Reports marginal rate, effective rate and remaining headroom in your current bracket. Federal only — there is no state tax calculation anywhere in HelloMula.
SECURE Act 2.0 start ages by birth year, with a multi-year schedule, qualified charitable distribution handling and estimated tax impact. This is among the more complete models in the product.
Exact month-by-month amortisation for both your current schedule and an accelerated one, plus the future value of investing the same additional payment instead. The comparison is nominal: it weighs your mortgage rate against your assumed investment return without adjusting for the mortgage interest deduction, the tax on investment gains, or the fact that prepaying a mortgage is a guaranteed return while investing is not. Read it as one input, not a verdict.
Compares converting your entire traditional IRA balance in a single year at a current tax rate you supply, against your expected retirement rate. This is a deliberately simple model. It does not support partial conversions, multi-year conversion ladders, filling to the top of a bracket, the pro-rata rule for non-deductible contributions, IRMAA Medicare surcharges, or state tax. Use it to size the question, not to plan the execution.
Your income against national wage percentiles for your occupation, from Bureau of Labor Statistics data. The wage data is from 2023 and is not updated live, so treat the percentile as approximate and expect it to understate current nominal wages.
Straightforward ratio and schedule arithmetic on your actual entered data. The methods are conventional; the value is that they run on your real numbers automatically rather than asking you to gather them.
The analyses HelloMula surfaces for review are ordered by a fixed weighting per analysis type, combined with how complete your inputs are and how many improvement suggestions the analysis produced. It is not ranked by dollar impact or by deadline, and it does not detect when two suggestions conflict. It is a reasonable prompt for what to look at next, and we do not claim more for it than that.
Every model simplifies. These are the simplifications ours makes, stated plainly. Some make the projection optimistic and some make it conservative. Federal income tax on withdrawals used to head this list; it is now modelled directly, and what remains of the tax picture is set out below.
| Not modelled | Effect on the result |
|---|---|
| State and local income tax, anywhere in the product | Makes results too favourable, by an amount that depends entirely on your state. Federal tax is modelled; state tax is not. |
| Capital gains and cost basis in taxable accounts | Makes results slightly too favourable. Withdrawals from the taxable share of the portfolio are treated as return of basis and taxed at zero, so the gains inside those accounts escape tax in the model but not in reality. |
| Future changes to tax law | Brackets and the standard deduction are indexed to your inflation rate, but the current rate schedule is held constant for the life of the projection. Scheduled sunsets and future legislation are not anticipated. |
| Withdrawal sequencing across taxable, traditional and Roth accounts | Withdrawals are taken pro-rata across the tax-deferred and taxable shares rather than in a chosen order. Real sequencing decisions can materially change after-tax outcomes. |
| Roth accounts as a distinct third bucket | The model splits the portfolio in two, tax-deferred and taxable. Roth balances behave like the taxable share here — withdrawn tax-free — but Roth conversion strategy is not modelled. |
| Required Minimum Distributions inside the projection | RMDs are computed by their own dedicated module, but do not feed the retirement simulation. A household forced to withdraw more than it needs would pay more tax than we show. |
| Net investment income tax and Medicare IRMAA surcharges | Makes results slightly too favourable for higher-income households, where a large withdrawal can trigger both. |
| Social Security cost-of-living adjustments | Makes the projection conservative. Your expenses inflate every year; your Social Security does not. Real benefits are COLA-adjusted, so your actual position is likely better than modelled on this axis. |
| Surplus Social Security reinvestment | Also conservative. In years where benefits exceed expenses, the surplus is not added back to the portfolio. |
| A separate retirement date for your partner | The accumulation-to-withdrawal switch uses the primary member’s retirement age. Your partner’s Social Security amount and claiming age are modelled independently; their retirement date is not. |
| Survivor outcomes on first death | Filing-status change, benefit step-down and asset transfer are not modelled. |
| Sequence-of-returns risk and historical backtesting | Returns are drawn independently each year, so real-world patterns — fat tails, multi-year drawdowns, mean reversion — are not represented. A poor first decade is modelled as no more likely than a poor last decade. |
| Asset allocation and glidepaths | One expected return and one volatility apply for the whole horizon. Shifting toward bonds as you age is not represented. |
| Pensions, annuities, rental income and part-time work | Not modelled as income sources. Add them to Social Security as a workaround, accepting that the tax treatment differs. |
| One-time income events | One-time expenses are supported; inheritances and business sales are not. |
| Estate and legacy planning | Out of scope. |
Re-running an analysis replaces the previous saved result. HelloMula does not currently store multiple named scenarios or offer a side-by-side comparison view.
Each analysis runs independently from your ledger. The Roth model does not know the marginal rate the tax estimator computed; the retirement projection does not know your RMD schedule. Where one analysis needs a figure another produced, you enter it.
Analyses read a six-month average of your income and expenses. If you stop entering for an extended period, that average describes a household you no longer are — and the results will still look confident while being out of date. See how HelloMula works day to day.
HelloMula performs calculations on data you supply. It does not know your complete financial situation, your risk tolerance, your tax circumstances or your goals, and nothing it produces is a recommendation to buy, sell, or hold any security, or to take any specific financial action. Outputs are modelling results for you to consider — ideally alongside a qualified professional who can see the whole picture. See our Disclaimer for the full statement.
If you believe a calculation on this page is described inaccurately, or you find a result you cannot reconcile, tell us. We would rather fix a model than defend one.
Free for up to 2 people. No credit card required.
The retirement projection and federal tax estimator described above are on the Household plan.